
What Is Average Selling Price (ASP)?
Average selling price (ASP) is the average amount a business receives for each unit of a product or service it sells over a given period. It reflects real transaction prices after discounts, rebates and negotiations, not the list price.
ASP is often confused with average order value (AOV). AOV measures the average value of a whole order or transaction, which may contain several items. ASP measures the average price per unit. A parts store might have an ASP of $60 per item but an AOV of $150 because customers often buy several items together.
Why Average Selling Price Matters
ASP helps businesses understand pricing power, product mix and market position.
- Pricing health: A falling ASP can signal heavy discounting, competitive pressure or a shift toward cheaper products.
- Product mix: Changes in ASP often reveal whether customers are buying up or down within your range.
- Forecasting: Multiplying expected unit sales by ASP gives a quick revenue estimate.
- Marketing math: ASP helps set realistic targets for cost per acquisition and return on ad spend, since higher-priced items can support higher acquisition costs.
How to Calculate Average Selling Price
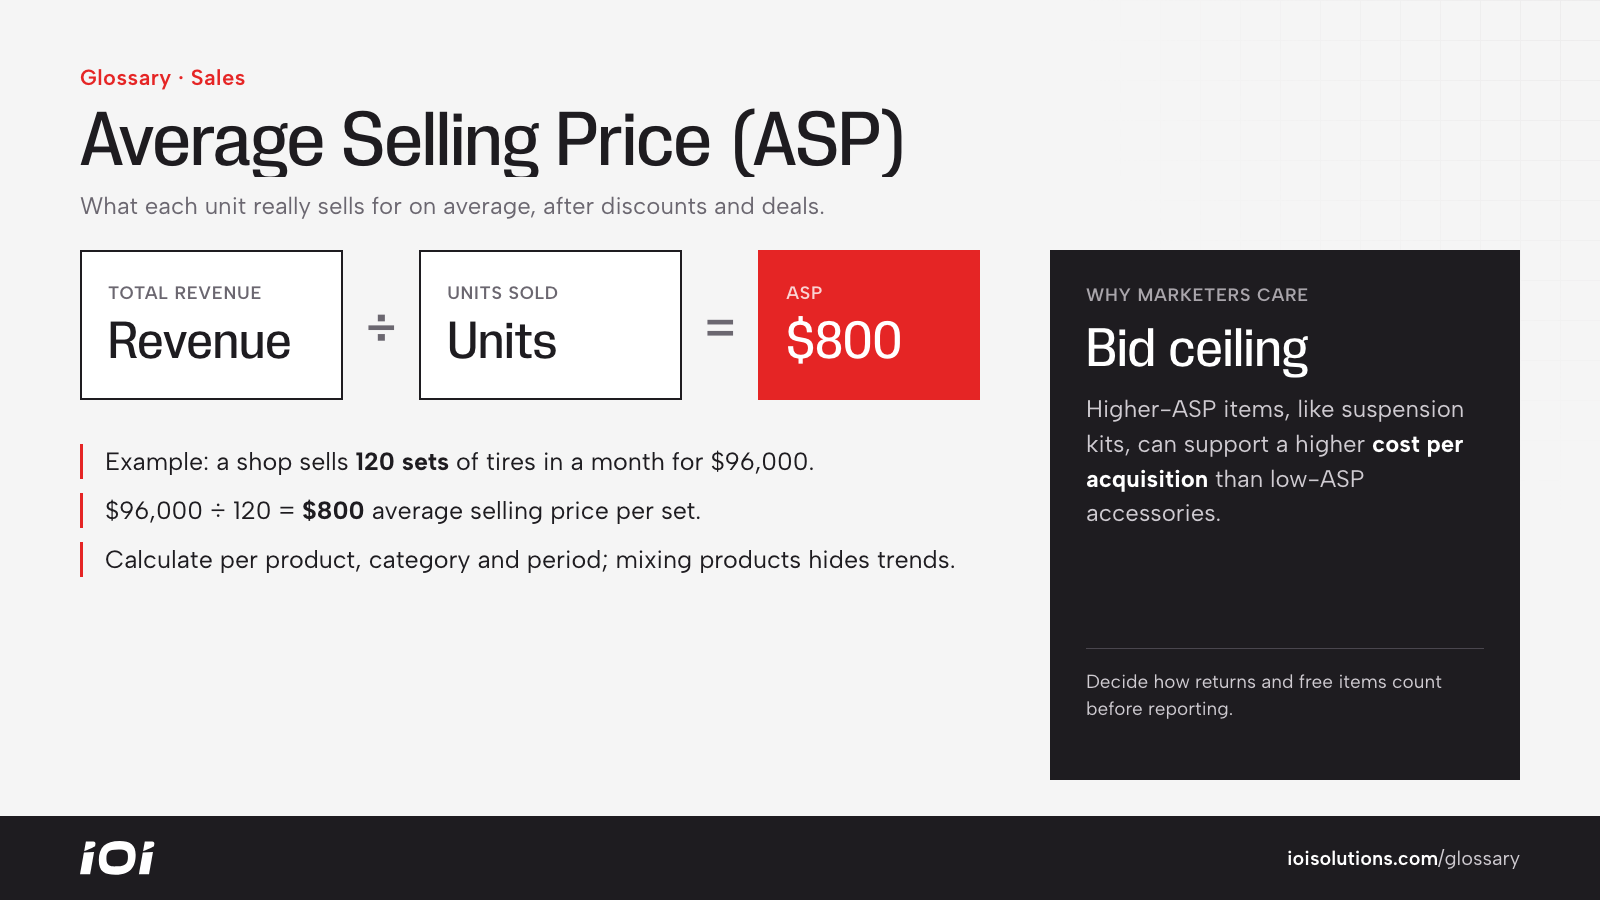
ASP = Total revenue from a product or category / Number of units sold
For example, if a shop sells 120 sets of tires in a month for total revenue of $96,000, the ASP is $800 per set. Always calculate ASP for a specific product, category and time period. Mixing very different products into one average can hide important trends.
Watch the inputs, too. Returns, warranty replacements and free promotional items can distort ASP if they are counted as units sold without matching revenue, so decide upfront how your reports treat them.
Average Selling Price in Automotive Marketing
ASP is a useful lens across automotive categories.
- Dealerships: Average transaction price per new or used vehicle is effectively ASP. Tracking it alongside gross profit measures such as per vehicle retail (PVR) shows whether price changes are coming from mix, market conditions or discounting. A store selling more trucks and fewer compact cars will see ASP rise even if pricing strategy has not changed.
- Repair and collision shops: Average revenue per repair order works like ASP for services. Comparing it by service type or by marketing channel can show which campaigns bring in larger jobs.
- Aftermarket and parts ecommerce: Brands can track ASP by product line, fitment group or channel. A high-ASP category like suspension kits may justify more aggressive search bids than low-ASP accessories.
- Detailers, PPF and wrap shops: Package mix strongly affects ASP. Promoting full-front PPF or ceramic coating packages rather than basic details raises average ticket.
- Automotive software: For subscription products, average price per seat or per rooftop serves a similar role.
For example, a wheel and tire retailer might notice that customers from a performance-focused ad campaign have a much higher ASP than those from a general tire sale campaign. That could justify a higher cost per click for the performance campaign.
Best Practices
- Calculate ASP by product, category, location and channel rather than one blended number.
- Use actual transaction prices after discounts and rebates, not list prices.
- Track ASP alongside volume and margin; a higher ASP is not good if units or profit fall.
- Use ASP to set acquisition cost targets for each product category.
- Watch for ASP drops during promotions and confirm the volume lift was worth it.
- Test upsell and bundle offers, then measure their effect on ASP and AOV together.