
What Is Engagement Rate?
Engagement rate is a percentage that shows how many people actively interacted with your content compared with how many saw it or visited. On social, “saw it” usually means reach or impressions. On social platforms, engagement usually includes likes, comments, shares, saves and clicks. On websites, analytics tools such as Google Analytics 4 define an “engaged session” based on time on site, multiple page views or a conversion event.
The idea is the same in both contexts: views tell you how many people were exposed, while engagement tells you how many cared enough to do something.
Why Engagement Rate Matters
Engagement is a signal of relevance. Content that people interact with tends to be shown to more people by social algorithms, and website sessions that engage are more likely to convert.
- Content quality check. Comparing engagement rates across posts shows which topics, formats and hooks resonate.
- Algorithmic reach. Platforms generally favor content that sparks interaction.
- Traffic quality. On a website, low engagement from a specific source can reveal poor targeting or a mismatched landing page.
Engagement is still a means, not an end. A post can draw plenty of likes without producing a single lead, so connect engagement to outcomes whenever you can.
How to Calculate Engagement Rate
For social media, a common version is:
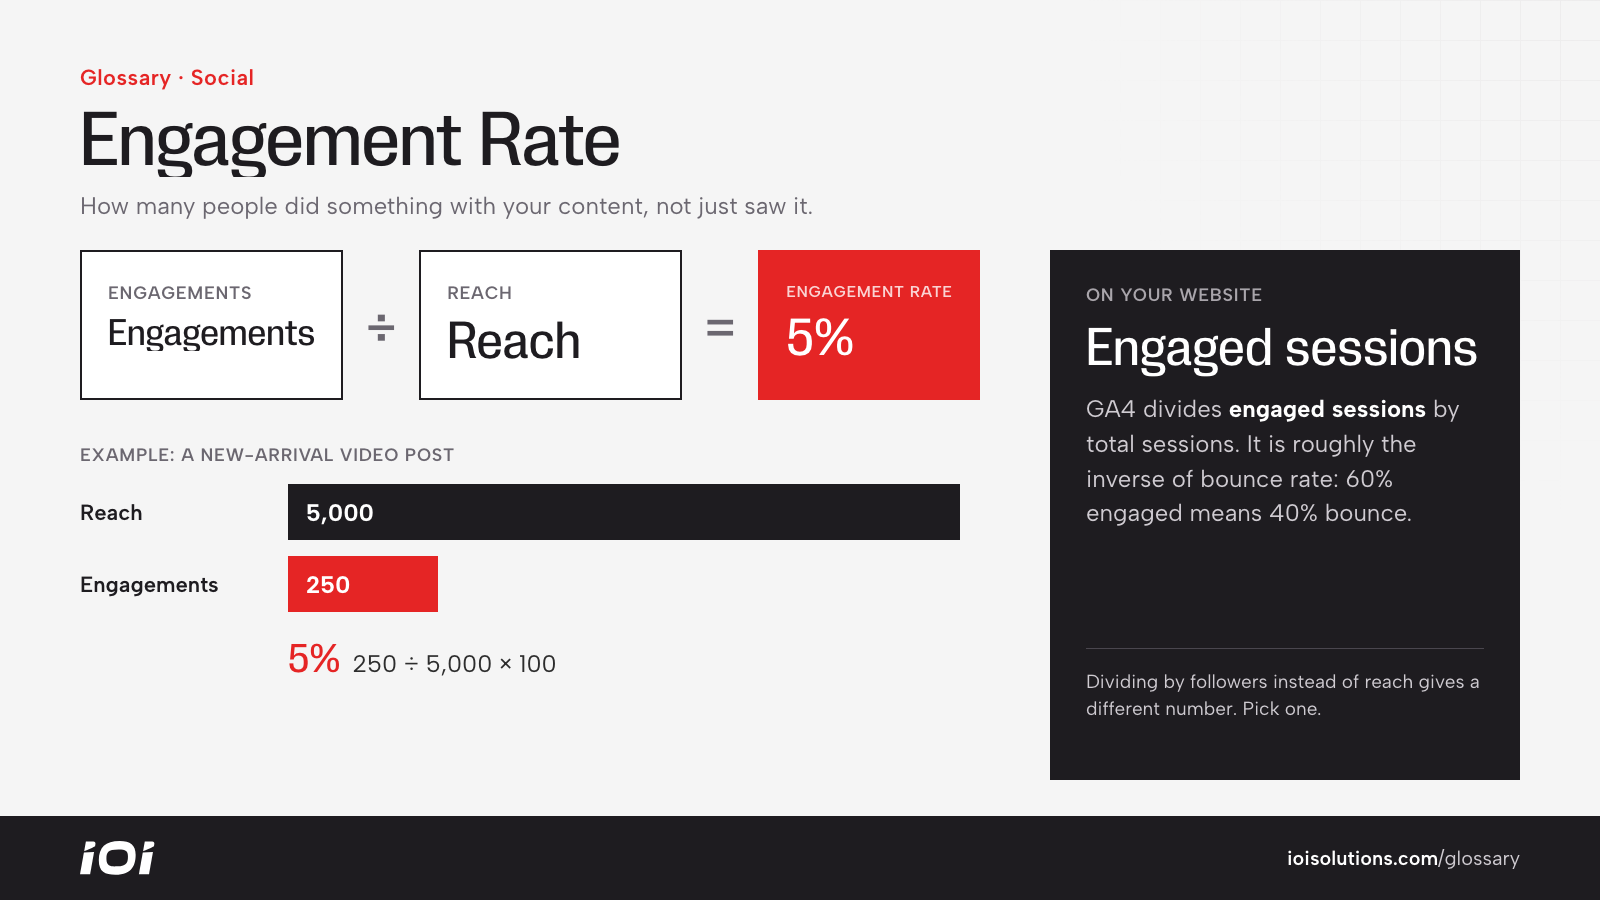
Engagement Rate = (Total Engagements ÷ Reach or Impressions) × 100
For example, a post that reaches 5,000 people and earns 250 likes, comments, shares and saves has an engagement rate of 5%. Some marketers divide by followers instead of reach. Each method gives different numbers, so choose one and use it consistently.
For websites in Google Analytics 4:
Engagement Rate = (Engaged Sessions ÷ Total Sessions) × 100
GA4 treats engagement rate as roughly the inverse of bounce rate, so a 60% engagement rate corresponds to a 40% bounce rate.
Engagement Rate in Automotive Marketing
Automotive content often performs well on social because vehicles are visual and many owners are passionate about them.
- Dealerships can compare engagement on new-arrival videos, staff spotlights and customer delivery photos to see what their local audience responds to.
- Detailers, wrap shops and PPF installers often see strong engagement from before-and-after reels and satisfying process videos, which also double as proof of quality.
- Parts and aftermarket brands may find build videos and customer-submitted photos outperform polished product shots.
- Repair and collision shops can use educational clips, such as explaining a warning light, to build trust.
For example, a ceramic coating shop might notice that short videos showing water beading on a freshly coated hood earn much higher engagement than static photos. Shifting more budget to that format and retargeting engaged viewers with a quote offer would connect engagement to actual leads.
On the website side, a dealer might find that engagement rate on vehicle detail pages is much lower from one marketplace referral source than from search, prompting a closer look at that traffic.
What Is a Good Engagement Rate?
Engagement rates vary widely by platform, industry, audience size and content format, and platforms change how they count interactions. Smaller, niche audiences often show higher rates than very large ones. Rather than chasing a generic benchmark, compare against your own recent average and against similar accounts.
- Use a consistent formula. Do not mix reach-based and follower-based rates in the same report.
- Hook viewers fast. The first second or two of a video largely decides whether people stay.
- Invite interaction. Ask questions, run polls and reply to comments promptly.
- Repeat what works. Identify your top-performing formats and produce more variations of them.
- Retarget engagers. Build audiences from people who interacted and serve them conversion-focused remarketing ads.
- Tie it to outcomes. Track how engaged audiences convert, not just how they interact.