
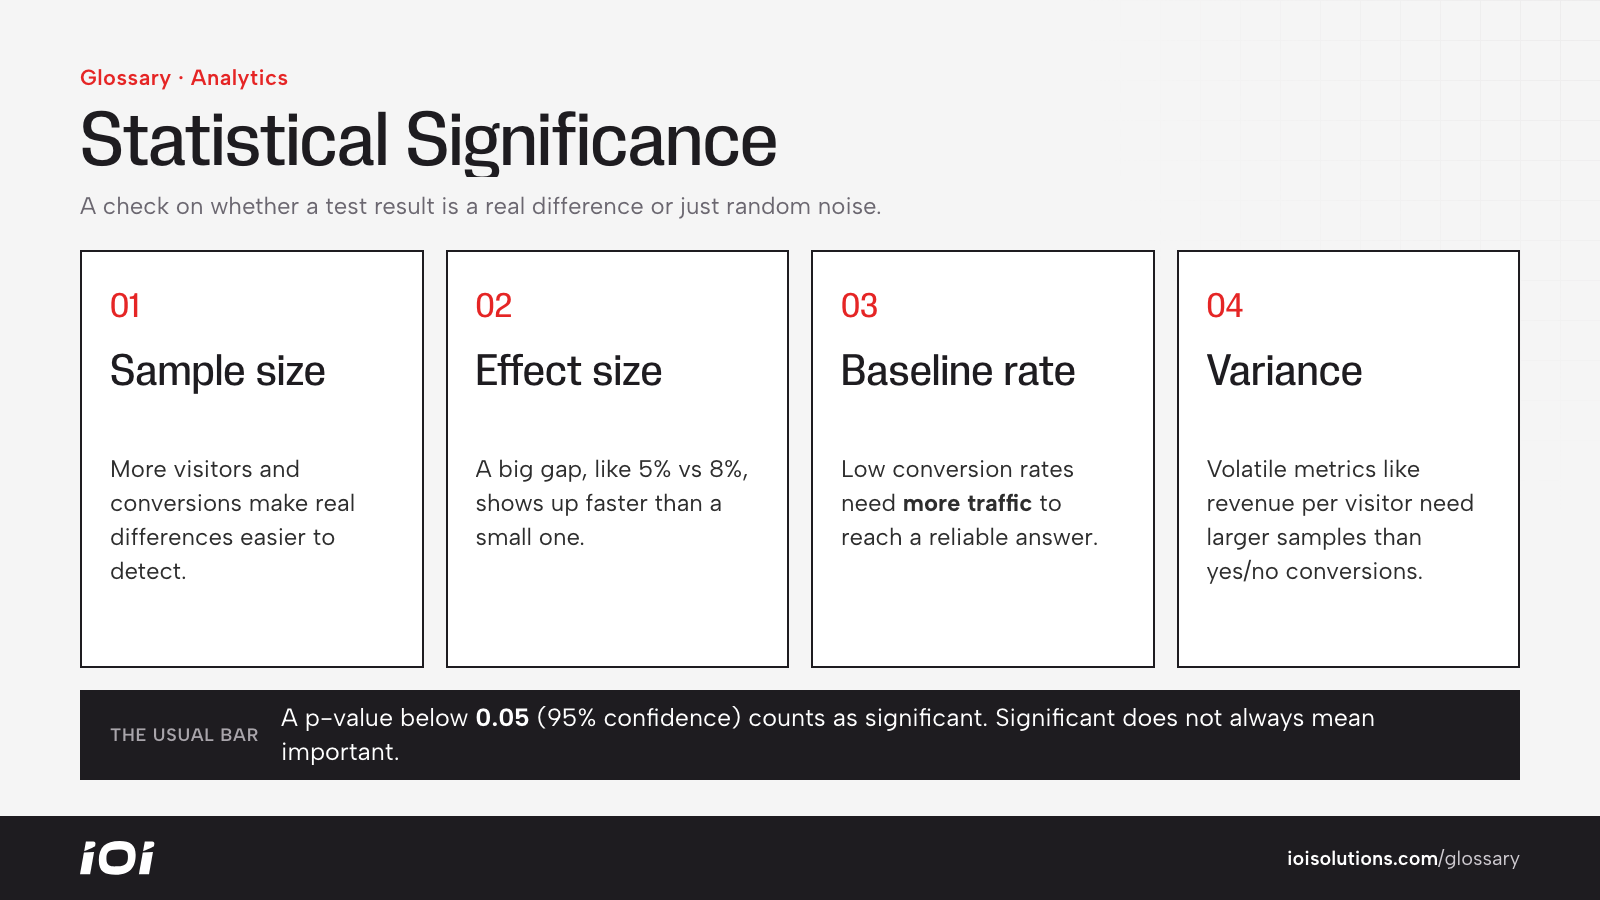
What Is Statistical Significance?
Statistical significance is a way of judging whether a difference you observe in data, such as one ad converting better than another, is likely to be real or could easily be explained by random variation. When a result is statistically significant, the data gives you reasonable confidence that the difference would hold up if you kept running the test.
In marketing, the concept is most often used with A/B tests. If version B of a landing page converts at 6% and version A at 5%, significance testing tells you whether that gap is meaningful or just noise from a small sample.
Why Statistical Significance Matters
Random variation is everywhere in marketing data. A campaign can have a great week for no particular reason, and a test can show a “winner” after a few days that disappears with more traffic. Acting on noise leads to wasted redesigns, wrong budget shifts and false confidence.
Checking significance helps you:
- Avoid declaring winners too early.
- Know when you have enough data to make a decision.
- Communicate results honestly to owners, clients and stakeholders.
How Statistical Significance Works
Significance testing starts with a null hypothesis: the assumption that there is no real difference between the versions. The test then calculates a p-value, the probability of seeing a difference at least as large as the one observed if the null hypothesis were true.
If p-value < significance threshold (commonly 0.05), the result is considered statistically significant.
A 0.05 threshold corresponds to the familiar “95% confidence level.” Some teams use 90% for lower-stakes decisions; others require 99% for major changes. Several factors affect whether a test reaches significance:
- Sample size. More visitors and conversions make it easier to detect real differences.
- Effect size. Large differences are detected faster than small ones.
- Baseline conversion rate. Low conversion rates need more traffic to reach a reliable answer.
- Variance. Volatile metrics, such as revenue per visitor, need larger samples than simple yes/no conversions.
Significance is not the same as importance. A tiny lift can be statistically significant on a huge site yet not worth the effort to implement. Always pair the p-value with the size of the improvement and its business impact.
Statistical Significance in Automotive Marketing
Many automotive businesses deal with modest traffic and relatively few conversions, which makes significance a practical concern rather than an academic one.
- A single-location repair shop with a few hundred landing page visits a month may need many weeks to validate a headline test. Testing bold changes, not subtle ones, gives it a better chance of reaching a clear answer.
- A dealer group can pool traffic across rooftops on a shared template to reach significance faster, provided the stores and audiences are similar.
- An aftermarket parts brand with high site traffic can test product page details more finely, but should watch revenue per visitor and average order value, not just add-to-cart rates.
- For example, a body shop comparing two Meta ad creatives over a weekend might see one generate twice as many leads. With only a handful of leads per version, that gap is very likely noise.
Best Practices
- Set your confidence level and minimum sample size before a test starts, and do not stop as soon as results look good.
- Use a sample size calculator based on your baseline conversion rate and the smallest lift you care about detecting.
- Run tests across complete weekly cycles to account for day-of-week behavior.
- Report the size of the lift and a confidence range, not just “winner” or “loser.”
- Be cautious when slicing results into many segments; the more comparisons you make, the more likely one looks significant by chance.
- When traffic is too low for formal testing, rely on bigger changes, qualitative research and trend data instead.